
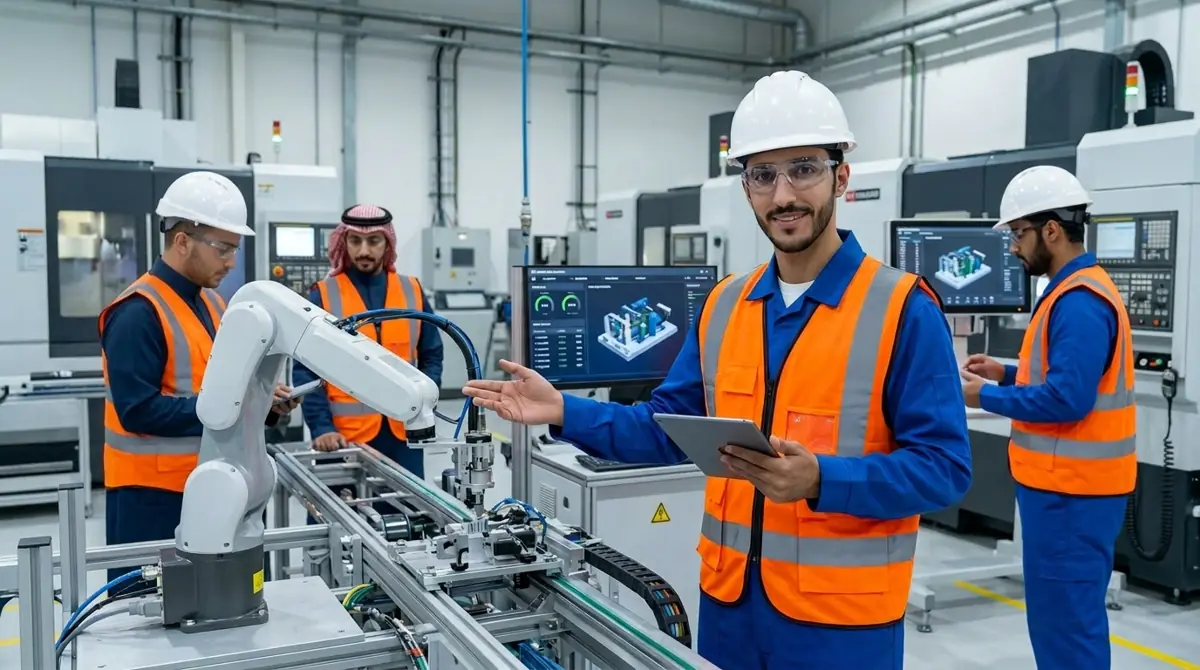

What Smart Manufacturing and Industry 4.0 Actually Mean
The term "Industrie 4.0" was introduced publicly at the Hannover Messe trade fair in Germany in 2011. It described a stage in which machines, sensors and planning systems are connected, so data moves from the shop floor to management and back without anyone re-keying it. Three stages came before it: steam-powered mechanization, electrified mass production, and automation with electronics and computers. What sets the fourth apart is not a faster machine but a machine that tells the system what it is doing as it does it.
In many mid-sized Saudi factories the reality looks different. A modern line with equipment perfectly capable of sending data sits alongside printed production orders, scrap written in the supervisor's notebook, and a product cost the accountant estimates after month-end. Smart manufacturing starts by closing that gap, and ERP is the backbone the other layers plug into. This guide explains the layers of a connected plant, the data foundation you need before buying a single sensor, the manufacturing functions an ERP covers, how to calculate overall equipment effectiveness, and a roadmap matched to your plant's maturity.
Why It Matters in Saudi Arabia Now
The Crown Prince launched the National Industrial Strategy on 19 October 2022, aiming to triple industrial output and reach 36,000 factories by 2035. Before that, the "Made in Saudi" program was launched on 28 March 2021 under his patronage to build confidence in Saudi products and support local content and exports.
For a factory owner this means more competition at home, more demanding buyers and government customers on quality, traceability and local content, and margin pressure on plants that do not know their true cost. A plant that knows the cost of every production order and can trace each batch from raw material to customer prices with more confidence and bids from a stronger position.
The Layers of a Connected Plant
| Layer | Role | Example data |
|---|---|---|
| Machines and sensors | Measure what actually happens on the line | Cycle counts, temperature, pressure, running or stopped |
| Line control systems | Run machines to set parameters | Setup recipe, line speed, alarms |
| Manufacturing execution system (MES) | Tracks work orders on the floor | Quantity per order, scrap, downtime reasons |
| ERP | Plans, costs and links production with sales, purchasing, inventory and accounting | Production orders, BOMs, stock, cost, sales orders |
Not every factory needs all four layers on day one. A small plant can start with an ERP where supervisors record quantities on a tablet at the line, then add automatic machine counters later. What matters is that the top layer is ready to receive data; otherwise sensors collect numbers nobody uses.
Foundation Before Sensors: Master Data
The Industry 4.0 projects that stall are usually the ones that bought sensors before sorting out basic data. Before connecting anything, the system needs:
- A bill of materials for each product: raw materials, components and quantities per unit, with allowed scrap rates, and multi-level BOMs for assembled products.
- Routings: the sequence of operations, the work center for each and its standard time, including setup time.
- Work centers and capacity: available hours per line or machine, shifts and planned maintenance days.
- A production calendar: working days, holidays and seasonal patterns that scheduling depends on.
- Quality specifications: inspection points, measured characteristics and accept or reject limits.
- Item coding: a barcode or consistent code for every material, product and batch.
Units of measure deserve special attention. Resin is bought by the tonne, stored by the bag and issued by the kilogram; finished goods are produced by the piece and sold by the carton. Without accurate conversion factors you get unexplained stock differences and every count becomes an argument. The same goes for substitute materials: if a product can use either of two resins from different suppliers, the BOM should know, so a production order does not stop when one runs out while the other sits in the warehouse.
ERP Functions in a Smart Factory
Material planning
The system takes sales orders and forecasts, nets off available stock and work in progress, explodes the BOM to find net requirements for each raw material per period, and proposes purchase orders using each supplier's lead time. That is the core of material requirements planning, covered in detail in our article on MRP for Saudi manufacturers.
Production scheduling
Once you know what to make, the system loads production orders onto lines and shifts against available capacity and the production calendar, and flags conflicts early: a line overloaded next week, or a material that will not arrive before an order is due to start.
Multi-level BOMs
For products built from sub-assemblies, a multi-level BOM gives full cost and requirements at every level and controls engineering changes so new orders never run on an outdated version. See multi-level BOM in Tranquil.
Quality checks
Inspection points at goods receipt, in process and on finished goods. Each result is recorded against the batch: a rejected raw material batch cannot be issued to production, and a rejected finished batch is not released for sale.
Barcodes and traceability
When materials are issued to an order by scanning and finished goods are recorded with their batch, you can trace in both directions: from any raw material batch to the customers who received products made from it, and back. That is exactly what you need for a complaint or a recall.
Actual production order cost
The system collects materials actually issued, labor hours booked and allocated overhead, and compares them with standard cost. Under IAS 2, fixed production overheads are allocated on normal capacity; the per-unit charge does not rise when output drops or machines stand idle, and the unallocated amount is expensed in the period. That matters a great deal in plants with volatile monthly volumes.
Maintenance
Preventive maintenance scheduled by calendar or running hours and coordinated with the production calendar so it does not clash with urgent orders. With sensor data available, you can move gradually toward condition-based maintenance.
Overall Equipment Effectiveness: A Worked Example
OEE is the most widely used measure of how well a line is used. It is the product of three factors: availability x performance x quality.
Hypothetical filling line on an 8-hour shift (480 minutes):
- Planned stops for breaks and cleaning: 30 minutes, so planned production time is 450 minutes.
- Unplanned stops for a breakdown and a mold change: 60 minutes, so run time is 390 minutes.
- Availability = 390 / 450 = 86.7%.
- Ideal rate is 100 units a minute, so theoretical output in 390 minutes is 39,000. Actual output is 33,150.
- Performance = 33,150 / 39,000 = 85%.
- Good units 32,155; rejects 995.
- Quality = 32,155 / 33,150 = 97%.
- OEE = 86.7% x 85% x 97%, roughly 71.5%.
The point of OEE is to show where capacity goes. Here the biggest loss is availability, an hour of unplanned downtime. If the reason for every stop is recorded for a few weeks, you will see whether mold changes are the real issue, and the fix may be a better setup procedure rather than a new machine. You do not need sensors to start: supervisors logging stops and reasons on a tablet is enough.
Hypothetical Example: Production Order Cost and Variances
An order for 10,000 plastic containers. The BOM specifies 25 g of resin per container with 3% standard scrap, at SAR 6 per kg. Standard time is 20 run hours, and the line-hour rate (direct labor plus overhead allocated on normal capacity) is SAR 350.
| Item | Standard | Actual | Variance |
|---|---|---|---|
| Resin | 257.5 kg x 6 = SAR 1,545 | 275 kg x 6 = SAR 1,650 | SAR 105 adverse |
| Line hours | 20 x 350 = SAR 7,000 | 23 x 350 = SAR 8,050 | SAR 1,050 adverse |
| Total | SAR 8,545 | SAR 9,700 | SAR 1,155 |
| Cost per container | About SAR 0.85 | SAR 0.97 | +13.5% |
The instinct is to blame material, but the numbers say most of the variance is time: three extra hours. With downtime reasons recorded on the order, the production manager can see whether it was a long mold change, a breakdown or waiting for material. If the pattern repeats, a selling price built on SAR 0.85 no longer reflects reality.
Traceability in Practice: A Customer Complaint
A customer reports cracked containers from last week's shipment. In an unconnected plant, someone starts digging through notebooks and paper delivery notes, and it can take days to identify the batch and resin source. In a plant that scans material issues and links batches:
- Enter the batch number from the label to see the production order, line, shift and date.
- See the resin batch used, its supplier and its incoming inspection result.
- See every other finished batch that used the same resin and which customers received them.
- Hold remaining stock of suspect batches and contact only the customers affected.
The difference is not just speed. Precise traceability means recalling two batches instead of a month of output.
Weekly KPIs for the Plant Manager
| KPI | Calculation | Where the data comes from |
|---|---|---|
| OEE | Availability x performance x quality | Run and stop times and quantities on production orders |
| Actual vs standard scrap | Actual consumption / BOM consumption | Material issues against output |
| First pass yield | Units accepted without rework / units produced | Quality check results |
| Schedule adherence | Orders completed on time / orders scheduled | Production order dates |
| Cost variance | Actual minus standard cost per order | Production order costing |
Review these with supervisors every week, not just at month-end. A scrap problem caught in week one costs a fraction of one found at the close.
Where IoT Adds Real Value
| Use | Expected value | Prerequisite |
|---|---|---|
| Automatic output counters | No manual entry, accurate order quantities | Each machine linked to its active order |
| Run and stop status | Accurate availability, visibility of short repeated stops | A standard list of downtime reasons |
| Temperature or pressure monitoring | Catching quality drift before defective volume builds up | Defined limits per product |
| Energy metering per line | Accurate energy cost per product | Separate meters per line |
| Vibration and running hours | Condition-based maintenance | Failure history to compare against |
A practical rule: do not install a sensor unless you know which decision its reading will drive. More examples are in our article on ERP and IoT.
A Roadmap by Plant Maturity
| Stage | Description | Next step |
|---|---|---|
| 1. Paper | Paper orders, estimated cost, annual stock count | ERP with BOMs, inventory and purchasing |
| 2. System with end-of-shift entry | Orders in the system, quantities keyed after the shift | Line-side entry on tablets with barcodes |
| 3. Live supervisor data | Scanned material issues, downtime and reasons logged | OEE and actual cost per order |
| 4. Machine connectivity | Counters and run status flow automatically | Root-cause analysis of scrap and downtime |
| 5. Data-driven improvement | Condition-based maintenance, adaptive scheduling | Extend to suppliers and customers |
Most mid-sized plants get the best return moving from stage one or two to stage three, at a fraction of the cost of full machine integration.
Common Mistakes
- Starting with hardware, not data: sensors feeding a dashboard that links to no order and no cost.
- Outdated BOMs: a permanent gap between actual and standard usage that destroys trust in reports.
- Ignoring setup time: schedules that look feasible on screen and are impossible on the line.
- OEE without reasons: a number with no explanation leads to no improvement.
- Not training supervisors: they are the first source of data, and if they do not see its value they will enter it carelessly.
Manufacturing in Tranquil
Tranquil's manufacturing coverage includes multi-level BOMs, material planning, production scheduling, a production calendar, quality checks and barcode integration, all connected to inventory, purchasing and financial accounting in one cloud system. The team can tailor screens, reports and API integrations to your plant. See manufacturing industry solutions, or contact us to assess where your plant stands.
Frequently Asked Questions
Do we need sensors to start with smart manufacturing?
No. Start with accurate master data in ERP and disciplined recording of quantities and downtime by supervisors. Machine integration comes later, once you know what you want to measure and why.
What is the difference between MES and ERP?
MES tracks what happens on the shop floor minute by minute. ERP plans production and connects it to sales, purchasing, inventory, costing and accounting. In small and mid-sized plants, ERP can cover much of the tracking need.
How is OEE calculated?
Availability times performance times quality: run time over planned time, actual output over theoretical output, and good units over total units.
Does unit cost go up in the books when output falls?
Under IAS 2, the fixed overhead per unit does not increase because of low output or idle plant. Overheads are allocated on normal capacity, and the unallocated part is expensed in the period.
Where should a paper-based plant begin?
With BOMs, inventory and purchasing in ERP, then production orders, then recording quantities and scrap at the line. Each stage builds on the one before.